
Body Composition and DEXA: A Practical Guide
The four numbers under your weight and why each matters


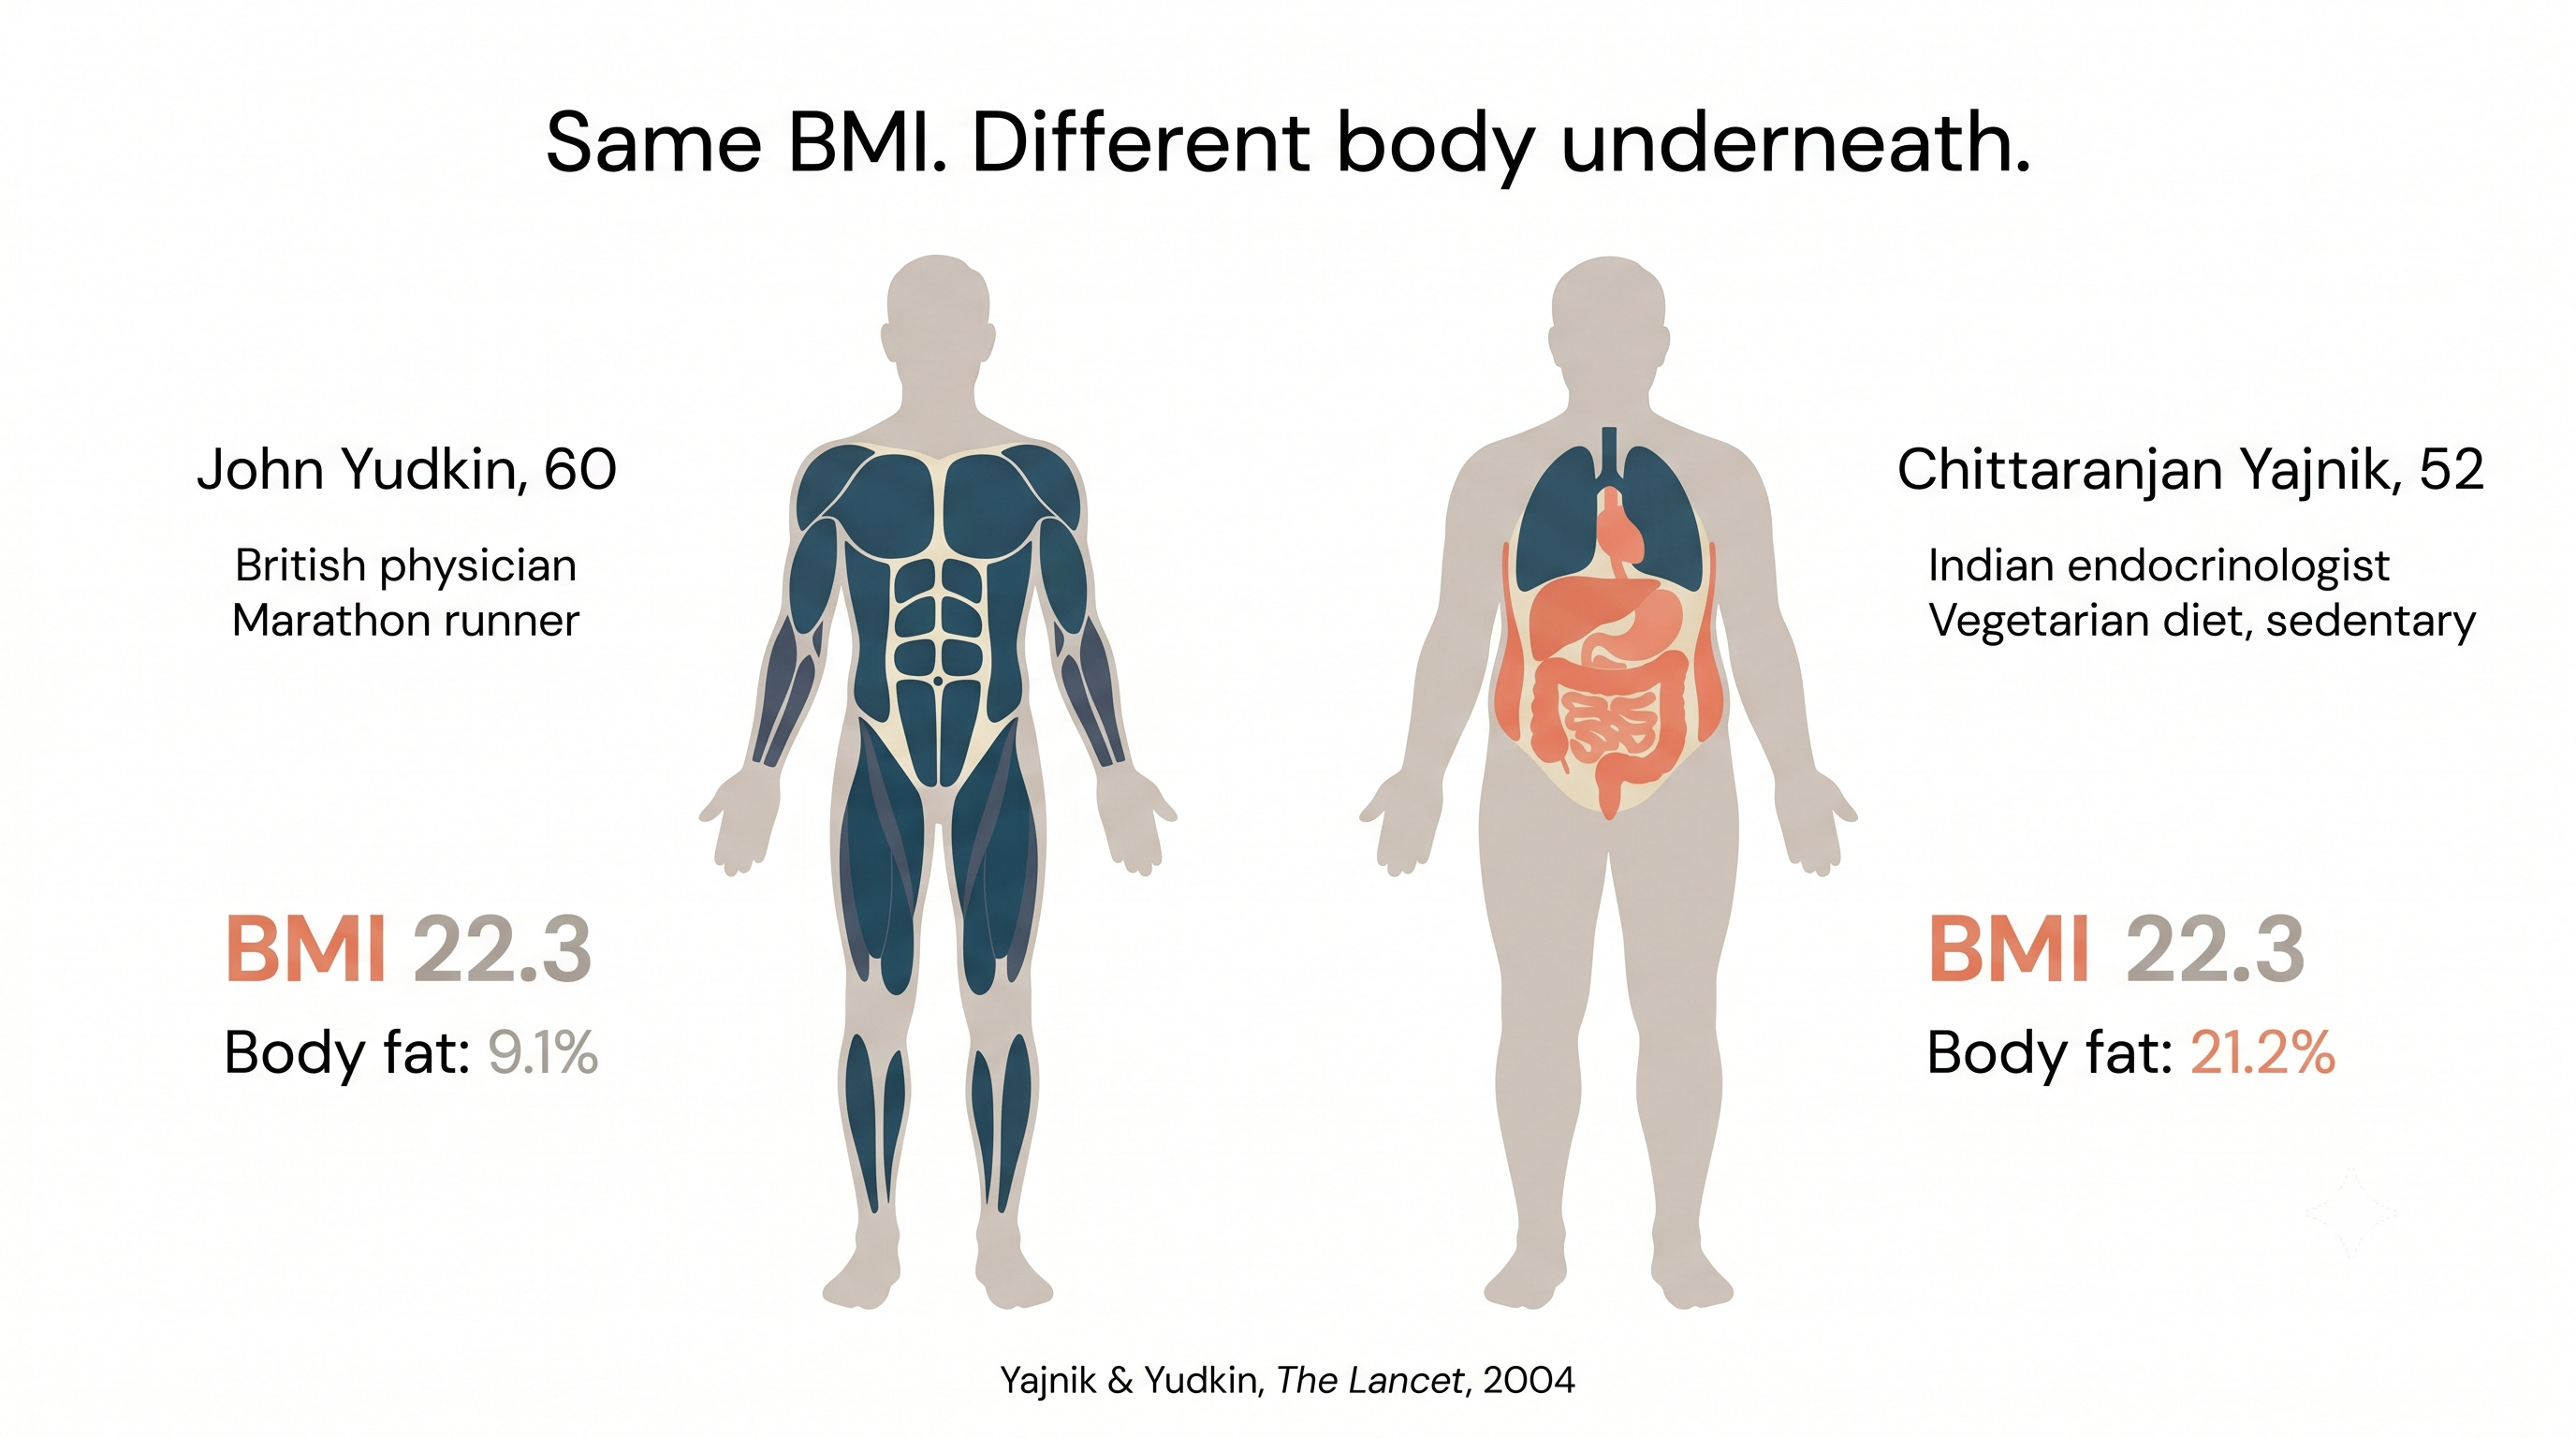
In 2003, two doctors stood next to each other for a DEXA scan. One was Chittaranjan Yajnik, an Indian endocrinologist. The other was John Yudkin, a British physician. They had identical BMIs of 22.3. By every screening number a doctor would normally use, they were the same body.
Yajnik’s body fat was 21.2%. Yudkin’s was 9.1%.
They published a single page in The Lancet and called it the YY Paradox (Lancet, 2004). The point was small and devastating. Same weight, same height, same BMI. Two completely different bodies. The fat that drives heart attacks and diabetes was sitting where the scale and the tape measure couldn’t see it. (Twice the body fat at the same weight. The scale couldn’t tell you which body was which.)
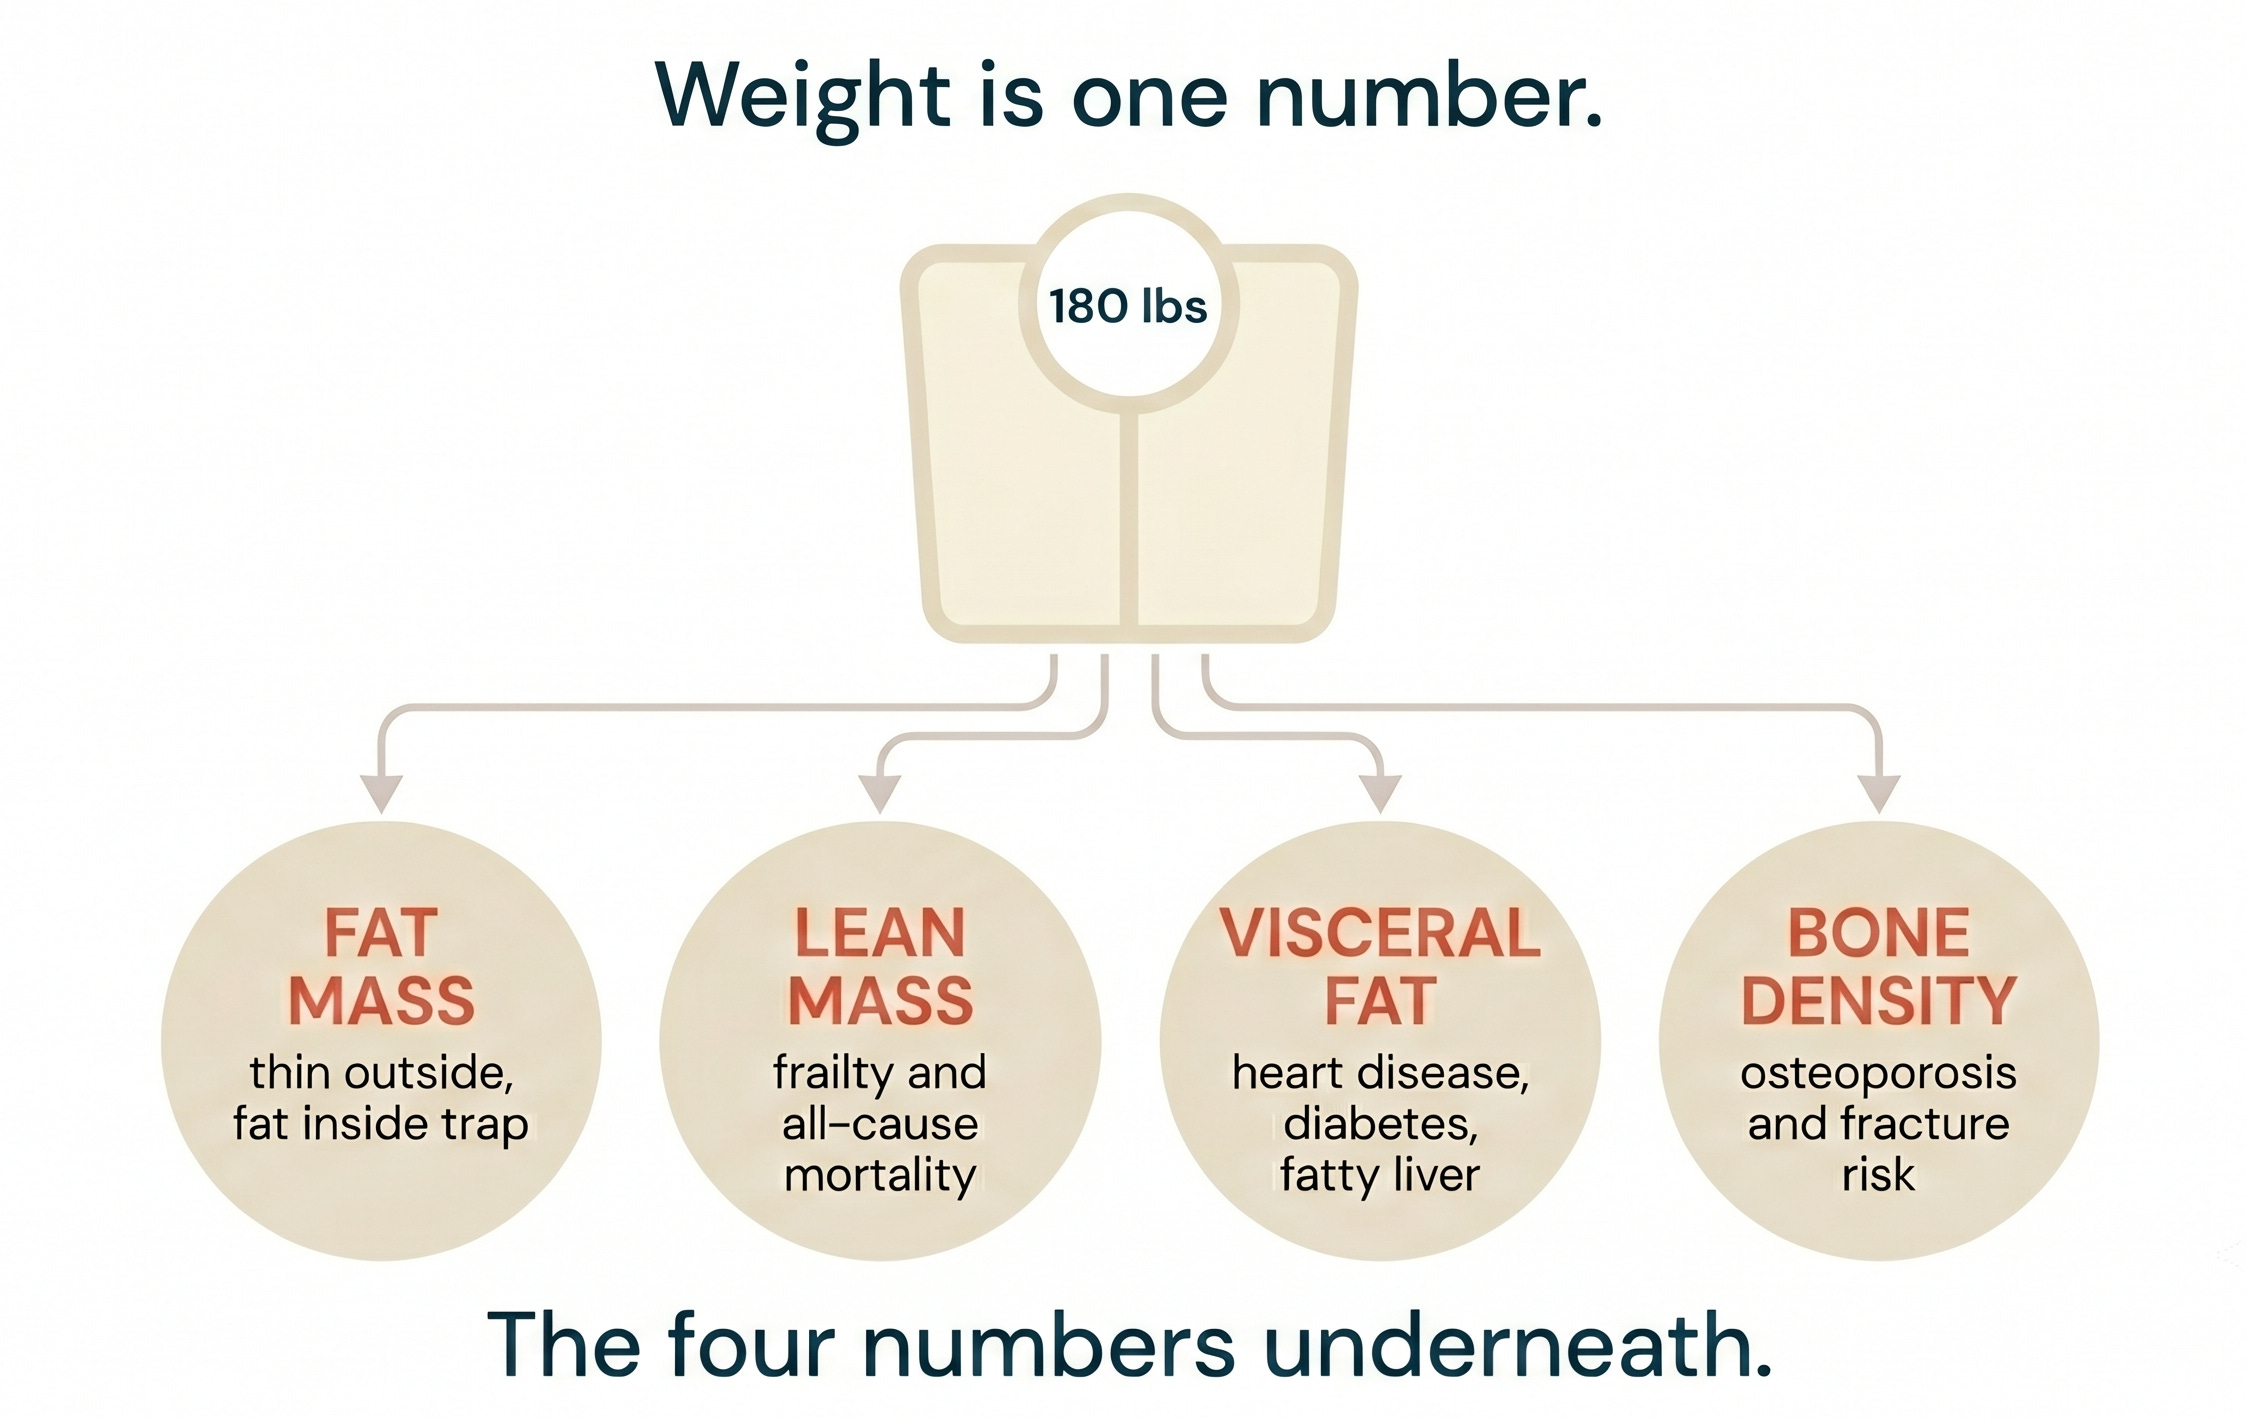
The lesson is bigger than DEXA. Weight is one number, and possibly the least interesting one on your body. The four numbers that predict how you’ll age are hidden underneath it.
TL;DR
Your weight is the sum of four things that age you very differently: fat mass, lean mass, visceral fat, and bone density. Each is independently predictive.
Lean mass predicts falls, frailty, and all-cause mortality after 60.
Visceral fat drives heart disease, diabetes, and fatty liver.
Body fat percentage catches the “thin outside, fat inside” trap.
Bone density triggers the only hard clinical decision in the set: treat for osteoporosis or not.
South Asians carry more body fat and less limb muscle at the same BMI than every other ethnic group studied. The scale is more misleading for us, not less.
The gold-standard tool that reads all four in one ten-minute scan: DEXA. $150-300, radiation about a day of background.
Weight is one metric. These four matter more.
Body weight is a sum. It is the only health number most people track because it is the only one a bathroom scale can produce. But the same 180 lbs can be a lean, strong body composition with low visceral fat, or a sarcopenic body with a fatty liver and an elevated fracture risk. The scale cannot tell you which one you have.
The four numbers it hides (fat mass, lean mass, visceral fat, and bone density) each track a different way the body fails over time. Each moves in response to different inputs. Each matters at a different age. Tracking your weight without knowing what’s underneath it is like tracking your portfolio’s total dollar value without knowing what’s in it. The number tells you what you have. It does not tell you what is working.
Lean mass is the strongest mortality signal in older adults. A meta-analysis of prospective cohort studies found that adults over 65 with low skeletal muscle mass had a 56% higher risk of all-cause mortality than those with normal muscle (PLOS One, 2023; systematic review and meta-analysis). The functional version is what most people feel before any lab confirms it: less strength, slower stairs, more falls, longer recovery from anything that puts you in a hospital bed. South Asians start with less to spare. Compared with European men of similar weight, height, and age, Asian Indians have significantly less skeletal muscle in their limbs along with more central fat (British Journal of Nutrition, 2009). What moves it: protein at 0.75 to 1g per pound of lean body mass, two to three resistance training sessions a week, enough sleep to recover, and optimized hormones. After 40, you are either building lean mass or losing it. There is no holding it steady by accident.
If you’re on a GLP-1, this matters more, not less.
In the SURMOUNT-1 DXA substudy, about 25% of every pound lost on tirzepatide (Mounjaro, Zepbound) was lean tissue (Diabetes, Obesity & Metabolism, 2025; n=160). A real-world analysis of nearly 8,000 patients found tirzepatide drove greater lean mass loss than semaglutide (Ozempic, Wegovy) in routine care (medRxiv, 2026; n=7,965). Without a DEXA, the scale tells you the drug is working. The DEXA tells you whether your protein and training are keeping the right tissue.
Visceral fat, the deep abdominal fat that wraps your liver and pancreas, drives heart attacks, type 2 diabetes, and fatty liver progression independent of BMI or total body fat. On your DEXA report it shows up in pounds or square centimeters; above 100 cm² (or about 2 lbs) is the threshold most clinicians flag as elevated cardiometabolic risk (Hologic DXA reference; Nicklas et al., Obesity Research, 2004). What moves it: cut refined carbs and ultra-processed food, add fiber and lean protein, layer in Zone 2 cardio two to three times a week, and fix sleep. We’ll cover the drivers and treatments as their own topic in the next issue.
Body fat percentage catches the “thin outside, fat inside” pattern the YY Paradox first showed. In a recent NHANES analysis of US adults aged 20 to 49, body fat above 27% in men or 44% in women carried a 78% higher all-cause mortality risk over 15 years and more than three times the risk of heart disease mortality, while BMI lost statistical significance after adjustment (Annals of Family Medicine, 2025). The BMI says you are fine. The body fat number says whether that is true. Healthy ranges run roughly 10-20% for men and 20-30% for women, though the right target depends on age and goals. What moves it: a sustained caloric deficit if you are cutting, paired with the resistance training that keeps lean mass on. The same sleep and stress hygiene that moves every other metric on this list. There is no shortcut that doesn’t show up as muscle loss on the next scan.
Bone mineral density is the only DEXA number that drives a hard clinical decision: whether to treat for osteoporosis. Roughly 1 in 3 women and 1 in 5 men over age 50 will experience an osteoporotic fracture in their remaining lifetime (International Osteoporosis Foundation; Kanis et al., Osteoporos Int, 2000). The T-score on your report tells you where you stand. Above -1 is normal. Between -1 and -2.5 is osteopenia. Below -2.5 is osteoporosis. South Asian women have lower bone mineral density on standard DEXA scans, and the T-score reference data was built on Caucasian populations. A “normal” T-score can still underestimate fracture risk for South Asian women (Zengin et al., Frontiers in Endocrinology, 2015; review). What moves it: adequate calcium, magnesium, and vitamin D; weight-bearing and resistance training; no smoking and alcohol kept low. Hormone therapy is FDA-approved for prevention of bone loss, and for women within 10 years of menopause and under 60, the Menopause Society endorses it for bone protection, not just symptoms (NAMS, Menopause, 2022).
DEXA: The gold standard for measurement
There are other options. Bathroom scales with bioelectrical impedance (BIA) are convenient and cheap, but their fat-percentage readings drift several points with hydration and time of day. Skinfold calipers depend entirely on the technician. The Bod Pod (air displacement) is accurate but rare and pricey. MRI is the most accurate way to measure visceral fat and ectopic fat inside the liver, but it runs $1,500 or more per scan and isn’t ordered for routine body composition tracking.
A DEXA scan shines two low-energy X-ray beams through your body. Bone, muscle, and fat absorb them differently, and the machine reconstructs how much of each you carry, and where. Ten minutes on a table. $150-300 in most US cities. For body composition tracking, it is the most practical tool we have. DEXA-measured visceral fat correlates with MRI at r=0.88 to 0.94 across validation studies (Obesity, 2022). MRI is more accurate at the extremes; for everyday tracking, it is overkill at ten times the price.
DEXA has real limits. It tends to overestimate visceral fat at very high volumes (above ~600 cm³) compared with MRI (Obesity, 2022), and different machines disagree by 1-2%, so the trend on the same machine matters more than any single absolute number. It also doesn’t see ectopic fat inside the liver, pancreas, or heart muscle, which is what an MRI-PDFF or cardiac MRI is for. The least significant change for visceral fat on a GE CoreScan is about 130 grams (Obesity, 2019). Anything smaller than that is measurement noise. Chase trends across two or three scans, not single readings.
What about radiation?
A whole-body DEXA delivers about 2-10 microsieverts (µSv) per scan, depending on the machine. Most centers come in around 5 µSv (COMARE 18th Report, UK Department of Health, 2019; review of DXA dose data). That is roughly one day of natural background radiation in the US, where the average person absorbs about 3,000 µSv per year from soil, cosmic rays, and radon at home.
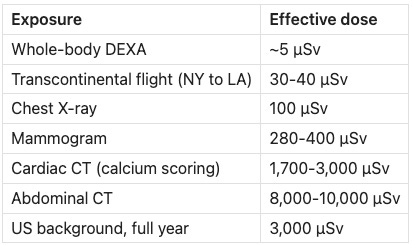
Exposure Effective dose Whole-body DEXA ~5 µSv Transcontinental flight (NY to LA) 30-40 µSv Chest X-ray 100 µSv Mammogram 280-400 µSv Cardiac CT (calcium scoring) 1,700-3,000 µSv Abdominal CT 8,000-10,000 µSv US background, full year 3,000 µSv
A DEXA is roughly 20 times lower than a chest X-ray and 1,000 times lower than an abdominal CT. The COMARE review estimated that a single DXA scan raises lifetime cancer risk by less than 1 in 1,000,000. Annual scans for body composition tracking, even sustained over decades, sit well inside the 20,000 µSv/year diagnostic exposure limit clinicians use as a guardrail. Pregnancy is the only common reason to defer.
How I use DEXA
I get a baseline DEXA every year. If I’m running a serious cut, a bulk, or starting a new medication that affects body composition, I add scans at the start and end of that window. The baseline is what makes the after number meaningful. Same scanning center every time. Machine-to-machine drift of 1-2% can swamp the real signal.
The first line I check on a new scan is lean mass. If lean dropped faster than fat in proportion, something in the plan is wrong. Protein is too low, the training stimulus isn’t enough, sleep is off, or the intervention is moving the wrong tissue. The report is most useful as an early warning, not a victory lap.
The clearest example I have is a six-month body recomposition window when I was using Tirzepatide. Between July 2024 and January 2025, I went from 244 to 226.5 lbs. The bathroom scale showed minus 17.5 pounds. The DEXA showed something different: fat down from 95 lbs to 69.5 lbs and lean mass up from 141 lbs to 149.8 lbs. Visceral fat down from 5.5 lbs to 3.89. Without the DEXA, the scale would have represented the change inaccurately. I have also had the opposite outcome, where I lost more lean mass than fat. DEXA caught it at the next scan, and I changed the plan before the next cycle.
Myth: “If the scale is going down, I am succeeding.”
The Myth: Weight loss is the goal. If the number on the scale is moving in the right direction, the plan is working.
The Evidence: Body weight is a sum. It hides what changed. In the SURMOUNT-1 DXA substudy of adults on tirzepatide, 25% of every pound lost was lean tissue (Diabetes, Obesity & Metabolism, 2025; n=160). The real-world digital phenotyping study found tirzepatide patients lost more lean mass than semaglutide patients, and the patients who lost the most lean mass also reported the most fatigue and reduced exercise tolerance (medRxiv, 2026; n=7,965). A separate review of older adults losing weight without structured strength training documented similar proportional muscle loss across multiple interventions (Mayo Clinic Proceedings, 2019; meta-analysis). The same 15 pounds on the scale can be a healthy recomposition, a clean fat loss, or a quiet muscle loss the reader will feel five years from now.
The Verdict: The weighing scale measures gravity. The DEXA measures what changed in the body. Especially after 40, and especially as a South Asian starting with less muscle to spare, the detailed numbers matter a lot.
Get a baseline DEXA before any major change
Before you start a new training program, a serious cut, or a medication that affects weight, get a DEXA. Repeat at six months. Ask the technician to include the visceral fat reading, since not every report does. The lean mass trend is the most important line on the report. For my South Asian patients, who often start with less muscle to spare, I treat that line as a safety check, not a vanity metric. If lean is dropping faster than fat in proportion, we change something (protein, exercise, or the intervention) before we keep going.
-Dr. Karan Bhalla
Disclaimer: The information provided in this article is for educational and informational purposes only. It is not intended as a substitute for professional medical advice, diagnosis, or treatment. Always seek the advice of your physician or other qualified healthcare providers with any questions you may have regarding a medical condition or wellness program. Reliance on any information provided in this article is solely at your own risk. The author and publisher of this article make no representations or warranties, express or implied, regarding the completeness, accuracy, reliability, suitability, or effectiveness of the information contained herein. The inclusion of specific products, services, or strategies in this article does not imply endorsement or recommendation. The author and publisher disclaim any liability for any adverse effects or consequences resulting from the use or application of the information presented. You are encouraged to consult with a qualified healthcare professional before making any changes to your diet, exercise routine, or lifestyle.